Outline of financial results
FY
| 2021 | 2022 | 2023 | 2024 | 2025 | |
|---|---|---|---|---|---|
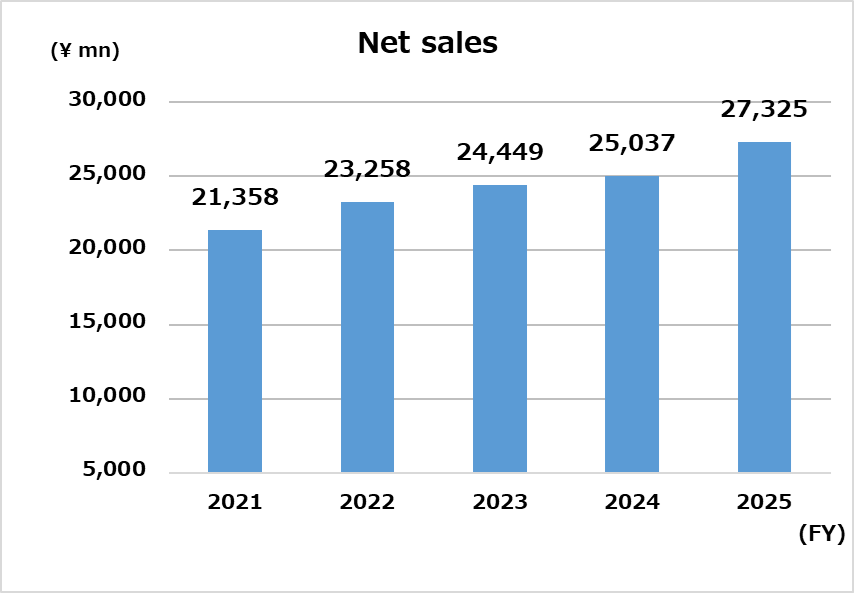
| Net sales(¥mn) | 21,358 | 23,258 | 24,449 | 25,037 | 27,325 |
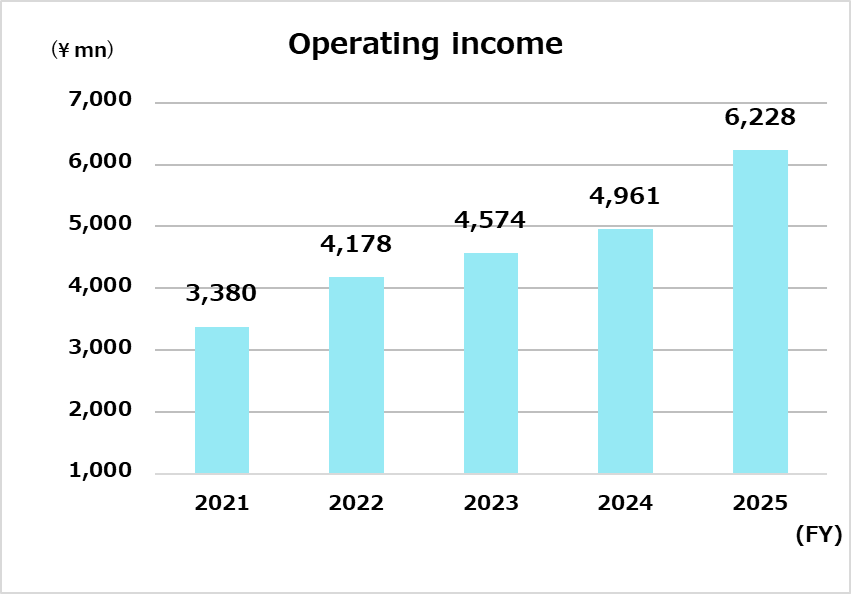
| Operating income(¥mn) | 3,380 | 4,178 | 4,574 | 4,961 | 6,228 |
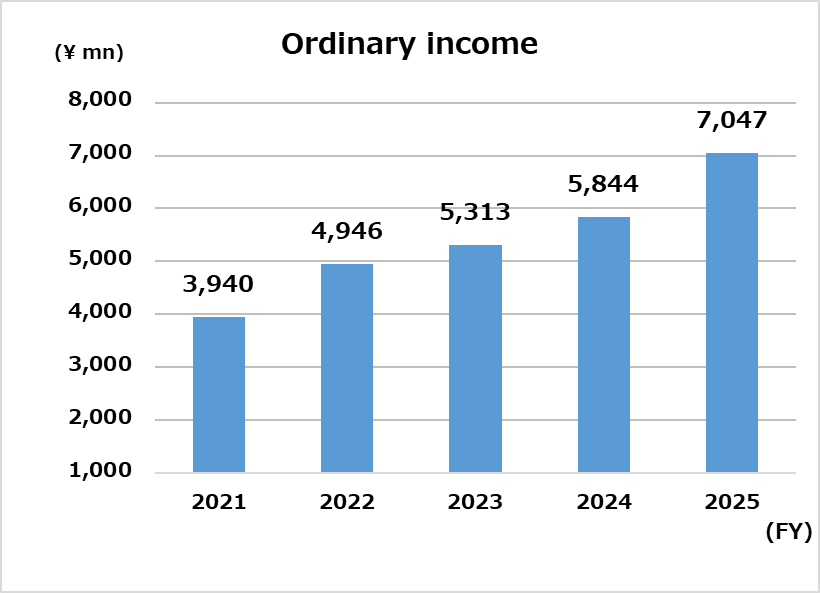
| Ordinary income(¥mn) | 3,940 | 4,946 | 5,313 | 5,844 | 7,047 |
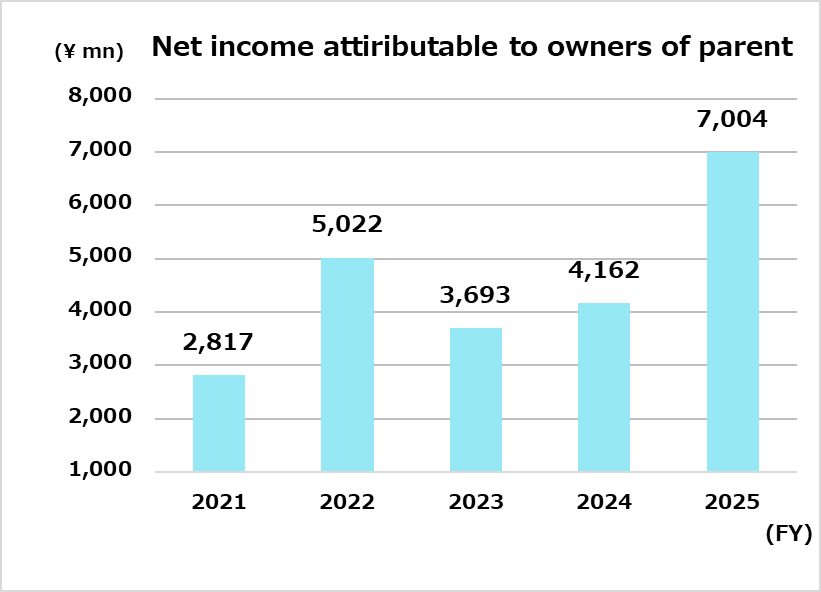
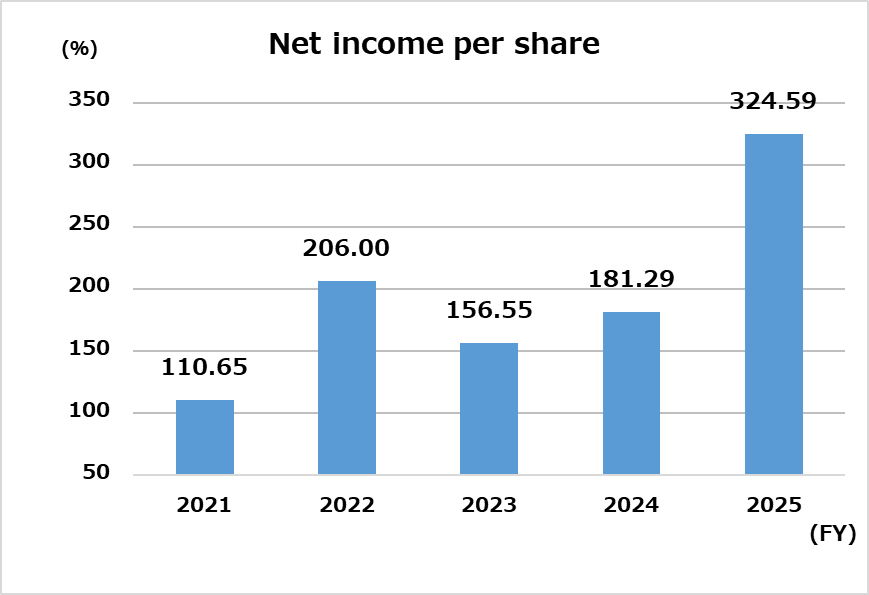
| Net income attributable to oweners of parent(¥mn) |
2,817 | 5,022 | 3,693 | 4,162 | 7,004 |
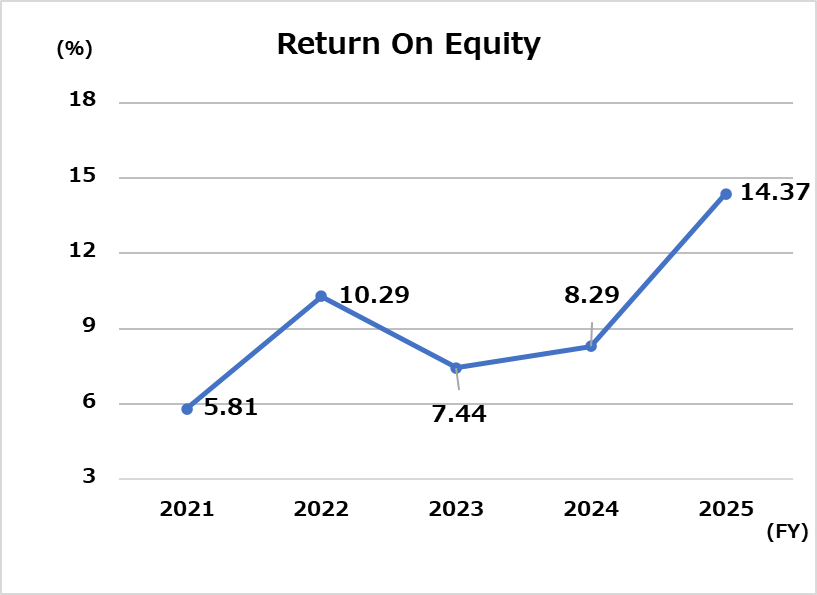
| Return On Equity(%) | 5.81 | 10.29 | 7.44 | 8.29 | 14.37 |
 |
 |
 |
 |
 |
 |
 |
|
Consolidated Balance sheet
¥mn/FY
| 2021 | 2022 | 2023 | 2024 | 2025 | |
| Assets | |||||
|---|---|---|---|---|---|
| Current assets | 44,820 | 47,032 | 45,926 | 45,772 | 43,276 |
| Tangible fixed assets | 10,030 | 10,480 | 10,115 | 10,354 | 10,584 |
| Intangible fixed assets | 405 | 205 | 347 | 325 | 297 |
| Investments and other assets | 1,107 | 1,285 | 1,531 | 1,893 | 2,200 |
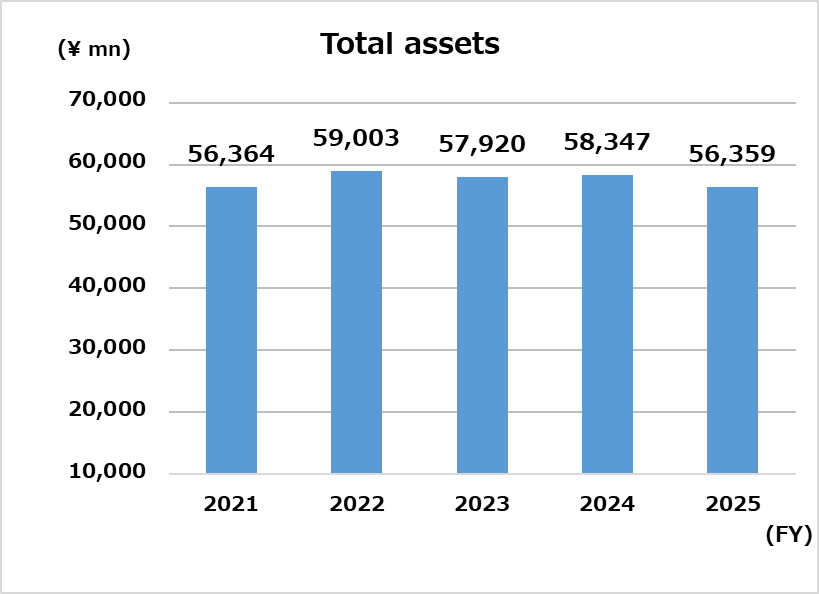
| Total assets | 56,364 | 59,003 | 57,920 | 58,347 | 56,359 |
¥mn/FY
| 2021 | 2022 | 2023 | 2024 | 2025 | |
| Liabilities and net assets | |||||
|---|---|---|---|---|---|
| Current liabilities | 5,162 | 7,177 | 4,313 | 4,931 | 5,045 |
| Long-term liabilities | 332 | 956 | 975 | 1,167 | 1,276 |
| Total liabilities | 5,494 | 8,133 | 5,289 | 6,099 | 6,321 |
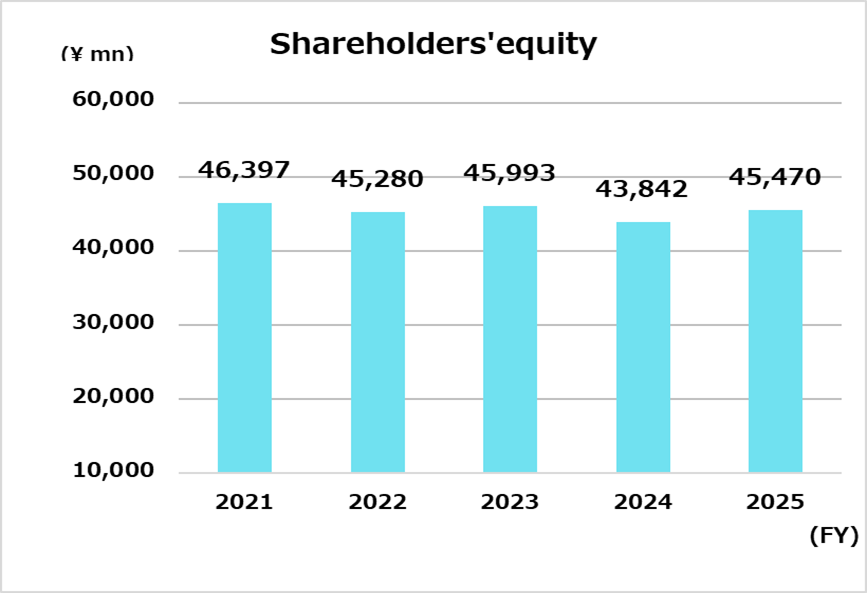
| Shareholders’ Equity | 46,397 | 45,280 | 45,993 | 43,842 | 45,470 |
| Total net assets | 50,869 | 50,869 | 52,631 | 52,247 | 50,037 |
| Total liabilities and net assets | 56,364 | 59,003 | 57,920 | 58,347 | 56,359 |
Consolidated cash flow statement
¥mn/FY
| 2021 | 2022 | 2023 | 2024 | 2025 | |
|---|---|---|---|---|---|
| Cash flows from operating activities | 3,716 | 5,087 | 5,192 | 6,545 | 4,888 |
| Cash flows from investing activities | △2,341 | △4,729 | △154 | 8,649 | △4,250 |
| Cash flows from finincing activities | △3,911 | △6,278 | △3,082 | △6,425 | △5,367 |
| Cash and cash equivalents at end of year | 19,330 | 13,655 | 15,737 | 24,806 | 20,099 |